

Debugging in the Browser

Hey, Awesome ones! Aryan this side👋 Full-Stack Developer, Life-Long Learner, Optimistic Using this blog to help code newbies. Learn with me! :)

Namaste, this is Aryan Sharma's blog, and I hope you're all doing well & great.
Welcome to another blog of this JavaScript course.
📍You can find my blogs here↗️
Let's get started!
Debugging
As we move forward with our course!
It's necessary to learn about debugging, let's dive in!
Debugging refers to the process of identifying, analyzing, and resolving errors or defects in software code, computer programs, or systems. It's an essential part of software development and maintenance, as errors or bugs in code can lead to incorrect behavior, crashes, or unexpected outcomes.
The “Sources” panel
Your Browser version may look a little bit different, but it still should be obvious that it is there.
I have my Brave browser open.

Click the right button of the mouse and this will open.
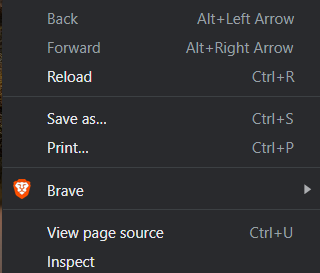
Now, click on inspect and this will open.

Here we have css, js and app folders and a dashboard.html file in js folder.
Now you could click the same toggler again to hide the resources list and give the code some space.
Console
To open the console, repeat the same steps as above.
This will open👇🏼

Now, 1+1 in console returns 2, but when we did message("hello"), it is returning nothing i.e. undefined.

Breakpoints
A breakpoint refers to a point in the source code where the execution of a program can be paused or interrupted for debugging purposes.
When a breakpoint is encountered during program execution, the debugger stops the program and allows developers to inspect the program's state, variables, memory, and other relevant information to identify and fix issues or understand how the code is behaving.
In main.js, click on line number 11. Yes, right on the 16 line not the code.
Congratulations! You’ve set a breakpoint.
(blue is where you should click)

While the code is paused, we can examine current variables, execute commands in the console etc. In other words, we can debug it.
breakpoints allows us to
The breakpoint in the code can be quickly reached by clicking on it in the right panel.
Unchecking it will temporarily deactivate the breakpoint.
By selecting Remove with the right click, you can remove the breakpoint.
The breakpoint in the code can be quickly reached by clicking on it in the right panel.
The command “debugger”
As we've seen we can stop code execution using breakpoints in console,
But how to use a debugger command while writing code🤔
Let's learn about it!
function message(name) {
  let hii = `Hello, ${name}!`;

  debugger;
// code will stop exexuting after using the command
  say(hii);
}
🛑Such a command works only when the development tools are open, otherwise the browser ignores it.
Tracing the execution
Now it’s time to trace the script.
There are buttons for it at the top of the right panel. Let’s engage them.
- – “Resume”: continue the execution, hotkey F8.
Resumes the execution. If there are no additional breakpoints, then the execution just continues and the debugger loses control.
Here’s what we can see after a click on it:
- – “Step”: run the next command, hotkey F9.
Run the next statement. If we click it now,
alertwill be shown.Clicking this again and again will step through all script statements one by one.
- – “Step over”: run the next command, but don’t go into a function, hotkey F10.
Similar to the previous “Step” command, but behaves differently if the next statement is a function call (not a built-in, like
alert, but a function of our own).If we compare them, the “Step” command goes into a nested function call and pauses the execution at its first line, while “Step over” executes the nested function call invisibly to us, skipping the function internals.
The execution is then paused immediately after that function call.
That’s good if we’re not interested to see what happens inside the function call.
- – “Step into”, hotkey F11.
That’s similar to “Step”, but behaves differently in case of asynchronous function calls. If you’re only starting to learn JavaScript, then you can ignore the difference, as we don’t have asynchronous calls yet.
For the future, just note that “Step” command ignores async actions, such as
setTimeout(scheduled function call), that execute later. The “Step into” goes into their code, waiting for them if necessary. See DevTools manual for more details.- – “Step out”: continue the execution till the end of the current function, hotkey Shift+F11.
Continue the execution and stop it at the very last line of the current function. That’s handy when we accidentally entered a nested call using , but it does not interest us, and we want to continue to its end as soon as possible.
- – enable/disable all breakpoints.
That button does not move the execution. Just a mass on/off for breakpoints.
- – enable/disable automatic pause in case of an error.
When enabled, if the developer tools is open, an error during the script execution automatically pauses it. Then we can analyze variables in the debugger to see what went wrong. So if our script dies with an error, we can open debugger, enable this option and reload the page to see where it dies and what’s the context at that moment.
Continue to here
Right click on a line of code opens the context menu with a great option called “Continue to here”.
That’s handy when we want to move multiple steps forward to the line, but we’re too lazy to set a breakpoint.
Logging
We do console.log to get an output of our code on the console.
For instance, this outputs values from 0 to 5 to console:
for (let i = 1; i <= 5; i++) {
  console.log("value,", i);
}
To see that output, open the console. Either you can inspect and open the console or you can press the key while in another panel, that opens the console at the bottom.
If we have enough logging in our code, then we can see what’s going on from the records, without the debugger.

I hope you loved this blog💝
See you in the next blog...Stay tuned🎶


